From the Student Success Scorecard (SSS) at the State Chancellor's Office:
"In its commitment to increase transfer and degree and certificate attainment, the California Community Colleges Board of Governors has established a performance measurement system that tracks student success at all 112 community colleges."
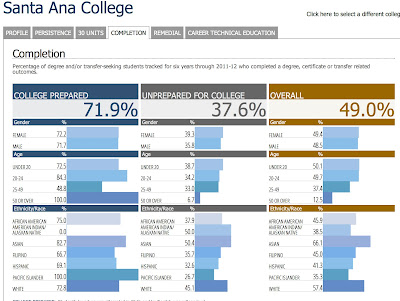
Below, I provide SSS data in five categories (I only excluded the "college profile" category) for the following local community colleges:
• Irvine Valley College (SOCCCD)I've also included data re the full-time/part-time faculty ratio per college (district)
• Saddleback College (SOCCCD)
• Orange Coast College (CCCD)
• Santa Ana College (RSCCD)
• Santiago Canyon College (RSCCD)
SEE ALSO Community colleges to offer Web data on their performance (LA Times)
1. "PERSISTENCE":
(% students sticking with it, 3 terms)
 |
| IVC gets the lowest score for "persistence" (among these five colleges) and yet it gets the highest score for "completion." (See below.) Go figure. |
2. "30 UNITS":
(% students earning 30 units within 6 years)
3. "COMPLETION":
(% students completed degree [or...] within 6 years)
4. "REMEDIAL":
(% of initially remedial students to achieve college-level credits)
 |
| What's with the spectacularly high ESL figure? |
5. "CTE":
(% CTE/vocational students successful within 6 years)
Percentage of faculty who are full-time (Uh-oh):
IVC: 51.2%*
Saddleback College: 51.2%
Orange Coast College: 59.4%
Santa Ana College: 65.3%
Santiago Canyon College: 65.3%
Fullerton: 68%
*It appears that these figures—re F-T/P-T—are for the entire district of which the college is a part. Evidently, no effort was made to identify the ratios per college.
These data are taken from the same "Student Success Scorecard" website per "college profile." Specifically, these percentages concern "Percentage of Full-Time Faculty."
These data are taken from the same "Student Success Scorecard" website per "college profile." Specifically, these percentages concern "Percentage of Full-Time Faculty."
Why is the figure for SOCCCD so low?
As a friend reminded me today, unlike most local districts, which have been strapped for cash, our district has not let go many part-time instructors in recent years and that likely makes our FT/PT ratio unfavorable compared to other districts'.
Also:
Recently, despite a fiscal "emergency" (flat revenue combined with rising costs) Saddleback College decided to go forward with numerous full-time faculty hires; meanwhile, faced with a similar fiscal crisis, IVC administration sought to reduce the planned full-time hires. (Why? Because part-time instruction is cheap "slave labor.")
Years ago (see below), legislation was passed according to which the state's goal was 75% full-time instruction. Districts were directed to expend resources in securing that goal:
 |
| Re the full-time/part-time "faculty ratio," from Chancellor’s Office Legal Opinion, 2/23/11 |
 |
| Graph by DtB |


17 comments:
But our IVC speech team is Number One in the Universe so who gives an F%&!.
All this will do is increase the pressure to pass students who have not earned it. The administration is not willing to provide the funding the address the underlying problems regarding student failure.
Thanks for this! I've been waiting for the college to send something out but so far not a PEEP. Now I know why.
Of course different college serve different populations so there needs to be some deeper analysis done.
Interesting yes, but let's be careful drawing conclusions. However, the low f/t faculty percentage certainly explains a few things.
I think if we break out IVC from Saddleback in the f/t figure above, IVC would be lower. perhaps Glen or Craig could do that for us? It would be interesting to see the f/t percentage for those areas the state seems particularly interested in - math, English and ESL.
I'd like to hear some discussion about how fewer full-time faculty members affect student success. sometimes it feels like they are running the college like a fast food joint - just fill in the shifts the best you can.
Why haven't they distributed this to everyone yet? At OCC they did.
Perhaps this will be one of the subjects at next Wednesday's college forums. IVC's is at 12:30-2:00 in A-100 and Saddleback's at at the more reasonable time of 3-4:30.
These FT/PT figures seem misleading or confusing.
The Student Success (SS) website states that SOCCCD has a 51.2% FT/PT faculty ratio. Yet, the section of the CA ed code that you cite, asserts that the required 75% ratio is not FT/PT faculty ratio. Rather it states that 75% of "hours of credit instruction" must be taught by FT faculty. That is altogether different!
Although I'm not sure how current the data is, according to the IVC "Facts at a glance" page,(http://www.ivc.edu/resources/about/pages/facts.aspx), IVC has "129 full-time and approximately 371 part-time instructors." That is only a 25% FT/PT ratio.
I just assumed that these data and factoids concern, not literally the # of full-timers to # of part-timers, but rather FTs and PTs viewed as Full Time Equivalent Faculty (FTEF). No? --Roy
I keep encountering readers who "question" the data referred to here. Please be clear: these are not MY data; they are the data provided in the SSS by the state chancellor's office. I've provided the link.
For a college, we sure have some poor readers on campus. Sheesh!
I can't find the area showing the average $ pay per Full Time Faculty? I wonder how IVC/SC would rank in that measurement with other colleges
This site has a lot of interesting information re. compensation and staffing: http://datamart.cccco.edu/Faculty-Staff/Default.aspx
I might be able to figure this out if I spent more time, but I'll bet the hive mind here knows the answer so I'm just going to ask --
Does the data going into this Scorecard also include casual students who are just taking the occasional class? I graduated from college long ago and have no intention of getting another degree, but I take at least one SOCCCD class every year in an area that interests me. Am I affecting the Scorecard?
In addition, does "Completion" include everyone who transferred successfully to a 4-year, or only those who got an AA? I think most transfers are really only interested in the former and may not even attempt the latter.
Yes, IFNF, the data should include "casual students," a group to be targeted for elimination, I suppose. Essentially, the state wants to cut community college offerings to the bare minimum, and, naturally, casual course-takers, including those seeking "mere enrichment," will be among those hurt. Completion includes everyone, most definitely including those who transferred to a 4-year. Again, the idea is to run a very lean ship, and to eliminate any unnecessary passengers (e.g., those who cannot cite powerful reasons for "travel"). "Transfer" students and vocational (& CTE) students are, therefore, the prime "passengers" on the SS California CC.
That's what I've begun to fear...
CA and Mr. union Brown-nose sure have lots of gall trying to eliminate forced passengers. How about refunding some of my taxes?
Post a Comment